strategy("매매 전략", overlay=true, default_qty_type=strategy.percent_of_equity, default_qty_value=100)
sma_len1 = input.int(20, minval=1, title="sma_length")
sma_len2 = input.int(40, minval=1, title="sma_length")
sma_len3 = input.int(80, minval=1, title="sma_length")
sma_len4 = input.int(160, minval=1, title="sma_length")
sma_len5 = input.int(200, minval=1, title="sma_length")
sma_src = input(close, title="Source")
sma_offset = input.int(title="Offset", defval=0, minval=-500, maxval=500, display = display.data_window)
sma1_c = ta.sma(sma_src, sma_len1)
sma2_c = ta.sma(sma_src, sma_len2)
sma3_c = ta.sma(sma_src, sma_len3)
sma4_c = ta.sma(sma_src, sma_len4)
sma5_c = ta.sma(sma_src, sma_len5)
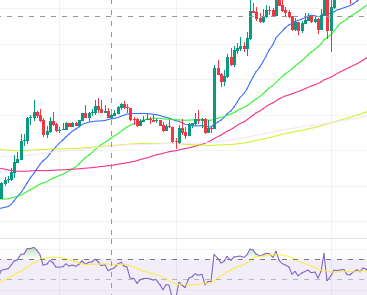
plot(sma1_c, title="SMA1", color=color.blue, offset=sma_offset)
plot(sma2_c, title="SMA2", color=#21f321, offset=sma_offset)
plot(sma3_c, title="SMA3", color=#f32183, offset=sma_offset)
plot(sma4_c, title="SMA4", color=#cdf321, offset=sma_offset)
plot(sma5_c, title="SMA5", color=color.rgb(248, 225, 250), offset=sma_offset)
ma1(source, sma_length, type) =>
switch type
"SMA" => ta.sma(source, sma_length)
"EMA" => ta.ema(source, sma_length)
"SMMA (RMA)" => ta.rma(source, sma_length)
"WMA" => ta.wma(source, sma_length)
"VWMA" => ta.vwma(source, sma_length)
typeMA = input.string(title = "Method", defval = "SMA", options=["SMA", "EMA", "SMMA (RMA)", "WMA", "VWMA"], group="Smoothing", display = display.data_window)
smoothingsma_length = input.int(title = "sma_length", defval = 5, minval = 1, maxval = 100, group="Smoothing", display = display.data_window)
smoothingLine1 = ma1(sma1_c, smoothingsma_length, typeMA)
smoothingLine2 = ma1(sma2_c, smoothingsma_length, typeMA)
smoothingLine3 = ma1(sma3_c, smoothingsma_length, typeMA)
smoothingLine4 = ma1(sma4_c, smoothingsma_length, typeMA)
smoothingLine5 = ma1(sma5_c, smoothingsma_length, typeMA)
plot(smoothingLine1, title="Smoothing Line1", color=#f37f20, offset=sma_offset, display=display.none)
plot(smoothingLine2, title="Smoothing Line2", color=color.rgb(243, 229, 32), offset=sma_offset, display=display.none)
plot(smoothingLine3, title="Smoothing Line3", color=color.rgb(32, 243, 67), offset=sma_offset, display=display.none)
plot(smoothingLine4, title="Smoothing Line4", color=color.rgb(32, 218, 243), offset=sma_offset, display=display.none)
plot(smoothingLine5, title="Smoothing Line5", color=#d020f3, offset=sma_offset, display=display.none)
ma6(RSI_source, RSI_length, type) =>
switch type
"SMA" => ta.sma(RSI_source, RSI_length)
"Bollinger Bands" => ta.sma(RSI_source, RSI_length)
"EMA" => ta.ema(RSI_source, RSI_length)
"SMMA (RMA)" => ta.rma(RSI_source, RSI_length)
"WMA" => ta.wma(RSI_source, RSI_length)
"VWMA" => ta.vwma(RSI_source, RSI_length)
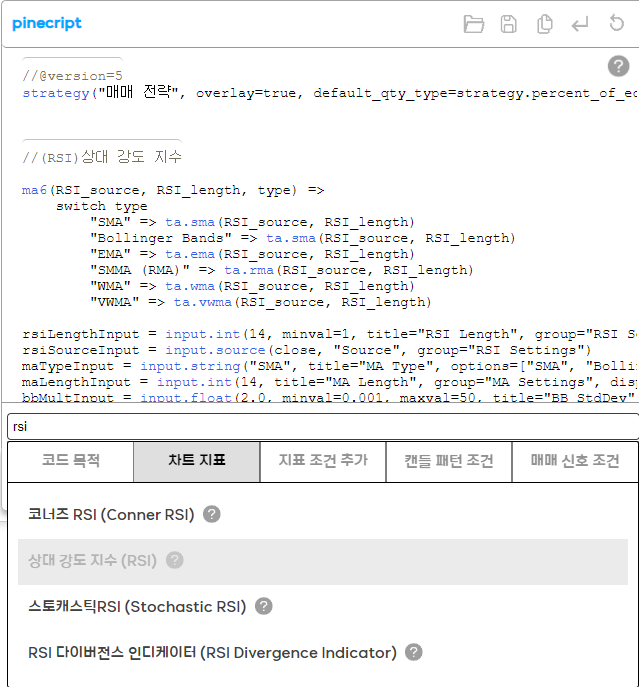
rsiLengthInput = input.int(14, minval=1, title="RSI Length", group="RSI Settings")
rsiSourceInput = input.source(close, "Source", group="RSI Settings")
maTypeInput = input.string("SMA", title="MA Type", options=["SMA", "Bollinger Bands", "EMA", "SMMA (RMA)", "WMA", "VWMA"], group="MA Settings", display = display.data_window)
maLengthInput = input.int(14, title="MA Length", group="MA Settings", display = display.data_window)
bbMultInput = input.float(2.0, minval=0.001, maxval=50, title="BB StdDev", group="MA Settings", display = display.data_window)
showDivergence = input.bool(false, title="Show Divergence", group="RSI Settings", display = display.data_window)
RSI_up = ta.rma(math.max(ta.change(rsiSourceInput), 0), rsiLengthInput)
RSI_down = ta.rma(-math.min(ta.change(rsiSourceInput), 0), rsiLengthInput)
RSI_rsi_c = RSI_down == 0 ? 100 : RSI_up == 0 ? 0 : 100 - (100 / (1 + RSI_up / RSI_down))
RSI_rsiMA_c = ma6(RSI_rsi_c, maLengthInput, maTypeInput)
RSI_isBB = maTypeInput == "Bollinger Bands"
rsiPlot = plot(RSI_rsi_c, "RSI", color=#7E57C2)
plot(RSI_rsiMA_c, "RSI-based MA", color=color.yellow)
rsiUpperBand_c = 70
rsimidline_c = 50
rsiLowerBand_c = 30
rsiUpperBand = hline(rsiUpperBand_c, "RSI Upper Band", color=#787B86)
RSI_midline = hline(50, "RSI Middle Band", color=color.new(#787B86, 50))
rsiLowerBand = hline(30, "RSI Lower Band", color=#787B86)
fill(rsiUpperBand, rsiLowerBand, color=color.rgb(126, 87, 194, 90), title="RSI Background Fill")
bbUpperBand = plot(RSI_isBB ? RSI_rsiMA_c + ta.stdev(RSI_rsi_c, maLengthInput) * bbMultInput : na, title = "Upper Bollinger Band", color=color.green)
bbLowerBand = plot(RSI_isBB ? RSI_rsiMA_c - ta.stdev(RSI_rsi_c, maLengthInput) * bbMultInput : na, title = "Lower Bollinger Band", color=color.green)
fill(bbUpperBand, bbLowerBand, color= RSI_isBB ? color.new(color.green, 90) : na, title="Bollinger Bands Background Fill")
midLinePlot = plot(50, color = na, editable = false, display = display.none)
fill(rsiPlot, midLinePlot, 100, 70, top_color = color.new(color.green, 0), bottom_color = color.new(color.green, 100), title = "Overbought Gradient Fill")
fill(rsiPlot, midLinePlot, 30, 0, top_color = color.new(color.red, 100), bottom_color = color.new(color.red, 0), title = "Oversold Gradient Fill")
lookbackRight = 5
lookbackLeft = 5
rangeUpper = 60
rangeLower = 5
bearColor = color.red
bullColor = color.green
textColor = color.white
noneColor = color.new(color.white, 100)
plFound = na(ta.pivotlow(RSI_rsi_c, lookbackLeft, lookbackRight)) ? false : true
phFound = na(ta.pivothigh(RSI_rsi_c, lookbackLeft, lookbackRight)) ? false : true
_inRange(cond) =>
bars = ta.barssince(cond == true)
rangeLower <= bars and bars <= rangeUpper
rsiHL = RSI_rsi_c[lookbackRight] > ta.valuewhen(plFound, RSI_rsi_c[lookbackRight], 1) and _inRange(plFound[1])
priceLL = low[lookbackRight] < ta.valuewhen(plFound, low[lookbackRight], 1)
bullCondAlert = priceLL and rsiHL and plFound
bullCond = showDivergence and bullCondAlert
plot(
plFound ? RSI_rsi_c[lookbackRight] : na,
offset=-lookbackRight,
title="Regular Bullish",
linewidth=2,
color=(bullCond ? bullColor : noneColor),
display = display.pane
)
plotshape(
bullCond ? RSI_rsi_c[lookbackRight] : na,
offset=-lookbackRight,
title="Regular Bullish Label",
text=" Bull ",
style=shape.labelup,
location=location.absolute,
color=bullColor,
textcolor=textColor
)
rsiLH = RSI_rsi_c[lookbackRight] < ta.valuewhen(phFound, RSI_rsi_c[lookbackRight], 1) and _inRange(phFound[1])
priceHH = high[lookbackRight] > ta.valuewhen(phFound, high[lookbackRight], 1)
bearCondAlert = priceHH and rsiLH and phFound
bearCond = showDivergence and bearCondAlert
plot(
phFound ? RSI_rsi_c[lookbackRight] : na,
offset=-lookbackRight,
title="Regular Bearish",
linewidth=2,
color=(bearCond ? bearColor : noneColor),
display = display.pane
)
plotshape(
bearCond ? RSI_rsi_c[lookbackRight] : na,
offset=-lookbackRight,
title="Regular Bearish Label",
text=" Bear ",
style=shape.labeldown,
location=location.absolute,
color=bearColor,
textcolor=textColor
)
AvTR_length = input.int(title="AvTR_length", defval=14, minval=1)
AvTR_smoothing = input.string(title="AvTR_smoothing", defval="RMA", options=["RMA", "SMA", "EMA", "WMA"])
AvTR_ma_function(source, AvTR_length) =>
switch AvTR_smoothing
"RMA" => ta.rma(source, AvTR_length)
"SMA" => ta.sma(source, AvTR_length)
"EMA" => ta.ema(source, AvTR_length)
=> ta.wma(source, AvTR_length)
AvTR_c = AvTR_ma_function(ta.tr(true), AvTR_length)
plot(AvTR_c, title = "ATR", color=color.new(#B71C1C, 0))
Longsignal = ta.crossover(sma1_c,sma5_c) and RSI_rsi_c > 65
LongStopsignal = sma1_c < sma2_c and RSI_rsi_c > 65 or RSI_rsi_c > 70 and AvTR_c > 800 or ta.crossunder(sma1_c,sma5_c) and RSI_rsi_c < 35
Shortsignal = ta.crossunder(sma1_c,sma5_c) and RSI_rsi_c < 35
ShortStopsignal = sma1_c > sma2_c and RSI_rsi_c < 35 or RSI_rsi_c < 30 and AvTR_c > 800 or ta.crossover(sma1_c,sma5_c) and RSI_rsi_c > 65
if(Longsignal)
strategy.entry("롱",strategy.long)
if(LongStopsignal)
strategy.close("롱")
if(Shortsignal)
strategy.entry("숏",strategy.short)
if(ShortStopsignal)
strategy.close("숏")


